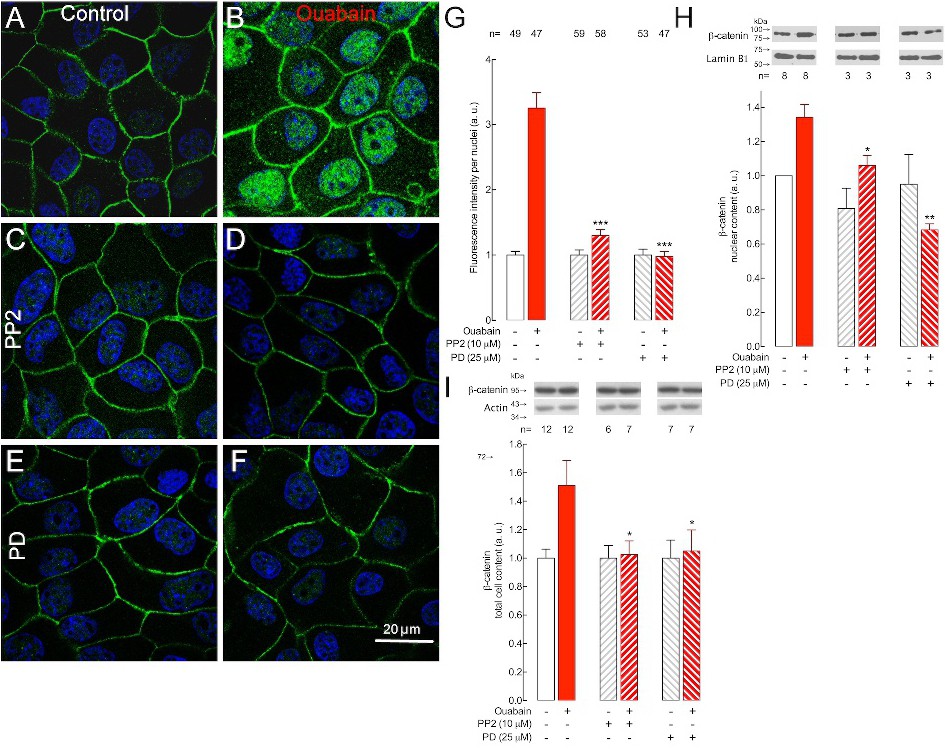
Fig. 4. Ouabain modulates β-catenin via c-Src and ERK1/2 activation. c-Src and ERK1/2 activity was impaired by 10 mM PP2 and 25 mM PD98059 (PD), respectively. (A) A control monolayer and (B) a monolayer treated with 10 nM ouabain for 8 h. (C and D) are monolayers analogous to (A and B), respectively, except that these monolayers were pretreated for 1 h and throughout the experiment with PP2. (E and F) are analogous to (A and B) except that these monolayers were pretreated for 1 h and throughout the experiment with PD. (G) Corresponding statistical analysis of the average fluorescence intensity per nucleus. Bars from left to right: white bars control cells, red bars ouabain-treated cells, cells pretreated with PP2, cells pretreated with PP2 for 1 h before adding ouabain, cells pretreated with PD, cells pretreated with PD before adding ouabain, and cells remaining in the presence of this substance. Abundance of β-catenin in (H) nuclear protein extracts and (I) cellular protein extracts. Bars shown in (H) are analogous to bars shown in (G). The n in (G) indicates the total number of nuclei measured in images obtained from four independent experiments, and in (H) and (I), the n indicates the number of independent Western blotting experiments. * P<0.05, ** P<0.01, *** p< 0.001. Data were analyzed by one-way ANOVA of ouabain plus inhibitor-treated cells (PP2 slashed and PD back-slashed red columns) vs. ouabain-treated cells (red column). In Fig. 4. G, n represents the number of nuclei observed in 3 independent experiments.